I don’t know much about tax. If quizzed, I probably say something relatively vague, heavily caveated, and based on little more than instinct. I suspect many people are similarly ill-informed, and often repeat views based on what’s perceived as the right perspective given their political tribe. These perspectives broadly fall into two camps:
- We should increase taxes to more fairly distribute wealth and solve many of society’s problems.
- We should decrease taxes to incentivise wealth creation, reward success, and solve many of society’s problems.
Perhaps there is a third camp who think tax is just right, but they don’t seem to be very vocal.
Humans have been experimenting with taxation since 3300 BC, but there still isn’t a unified consensus on the correct approach. Perhaps this isn’t so surprising given that the world’s economies are highly variable and constantly in flux.
You might expect there to be plenty of empirical evidence that neatly combines the complex scientific and human elements of taxation into real-life outcomes. However, governments and policies change regularly, making much of the historical data look spikey and inconsistent, with results also skewed by external events like wars or broader economic movements.
Even so, I’m hoping to uncover some objective data on what might be sensible tax policies, making me better informed for future debates. Achieving that is the purpose of this post, but if it also helps anyone else then all the better. I will try to draw conclusions based on evidence from reliable and non-partisan sources, otherwise it descends into an entirely pointless question of whether you believe journalist A or journalist B. This post looks primarily at tax in the UK, but I don’t see why the concepts wouldn’t be widely applicable.
What is Tax for?
To state the obvious, tax is a way for a government to raise money for state-funded activity. Very few people would argue that this isn’t necessary to some degree, but there’s plenty of dispute on the role of the state and extent to which public funding is necessary. Some might argue that tax policy should reduce economic inequality as far as possible, some might argue it should only provide bare minimum public services, and others might argue for a variety of other justifiable opinions.
I don’t want to get bogged down in ideological differences, partly because I tend to come out somewhere in the middle, and partly because they usually cause a complete deadlock. It should be possible to bypass ideology to some degree via quantifiable metrics, and use these to come to some useful conclusions.
One potentially relevant metric is poverty rate; it would be hard to argue that a country with high levels of poverty has a brilliant tax regime. It’s worth pointing out that poverty is not the same as economic inequality, explained in Paul Graham’s essay on the subject. This isn’t saying there is no link between poverty and inequality, just that they are different things. One common measure of ‘relative poverty’ in any given country is to define it as the share of the population with income below a certain proportion of the national median. Although this is a poverty metric, it does also provide some insight into inequality.
An income-based poverty metric doesn’t tell the whole story. What if a country had high levels of very low earners, all supported by excellent public services and a generous welfare state? A measure of life satisfaction should fairly reflect this scenario, as the low earners would feel much happier than their income might suggest.
So, the first questions I’ll try and answer are whether increasing tax decreases poverty, and whether increasing tax increases life satisfaction.
There are other more specific measures that could provide insight on whether a tax system works well or not, such as the quality of a nation’s healthcare or distribution of home ownership, but looking into these will have to wait for another post.
A Review of the Status Quo
Before trying to understand what might work better, it makes sense to review current and historical approaches. The UK government raised around £850 billion in 2023/24 from tax, plus another 10% from non-tax sources. The IFS provided a neat forecast for 2023/24 by tax type, which I assume ended up being broadly accurate.
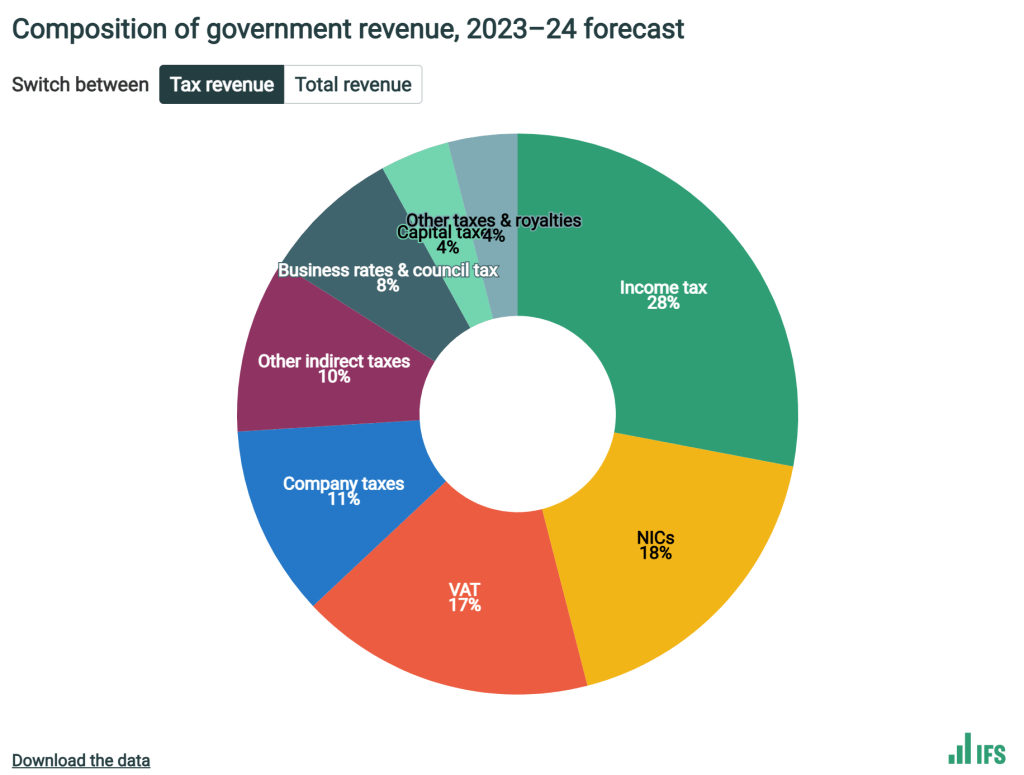
Source: IFS TaxLAB
The most noteworthy observation here is that almost 75% of all tax revenue comes from 4 sources: income tax, national insurance contributions, VAT, and company taxes (which is almost entirely corporation tax). Everything else is a bit of a side note, with capital gains tax (CGT) at just 1.7% and inheritance tax a barely noticeable 0.7%.
This was surprising to me given how often debate over CGT and inheritance tax makes headlines. I suspect this is because very small percentages still amount to very big numbers in the context of tax revenue, so it’s easy for tabloids to shout about “billions of pounds!”. There could be an argument to leave CGT and inheritance tax alone on the basis that they’re negligible, or an argument that things need to change so they’re not negligible anymore.
The UK government publishes total tax receipts and tax receipts as a % of GDP, and has plotted these going back to 2004. Tax receipts as a % of GDP provides an overall measure of the national tax burden, ignoring more granular detail on where the taxes come from. Even though it’s only a headline figure, it’s a useful metric I’ll use throughout this post.
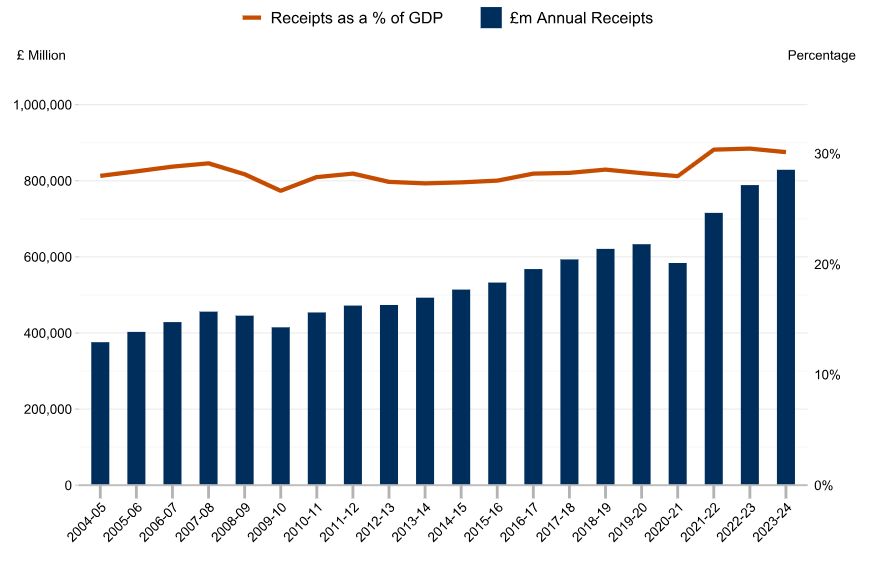
Source: UK Government
Absolute tax revenue steadily increases in almost perfect alignment with GDP, with dips for the 2008 financial crisis and 2020/21 pandemic. Receipts as a % of GDP has remained remarkably consistent, suggesting that any policy changes have been fiddling rather than meaningful.
Comparing the UK to other developed economies shows that our tax burden is at the lower end, but nevertheless part of a large group hovering between 30% and 35%.
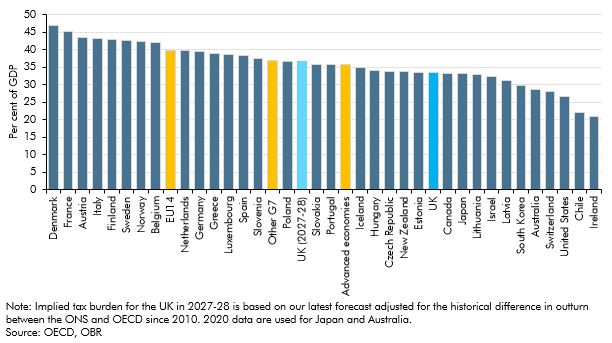
Source: OBR
Between 1965 and 2005 the UK’s tax receipts as a % of GDP varied much more than they have in the last 20 years. This has left us out of sync with European and G7 averages, which increased more smoothly.
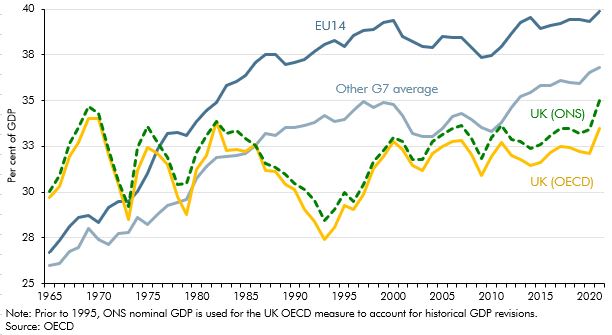
Source: OBR
One of the main discussion points surrounding tax is the relative contributions of the wealthy, and the extent to which the system ensures that they pay their fair share. The government also publishes this data, at least relating specifically to income tax.
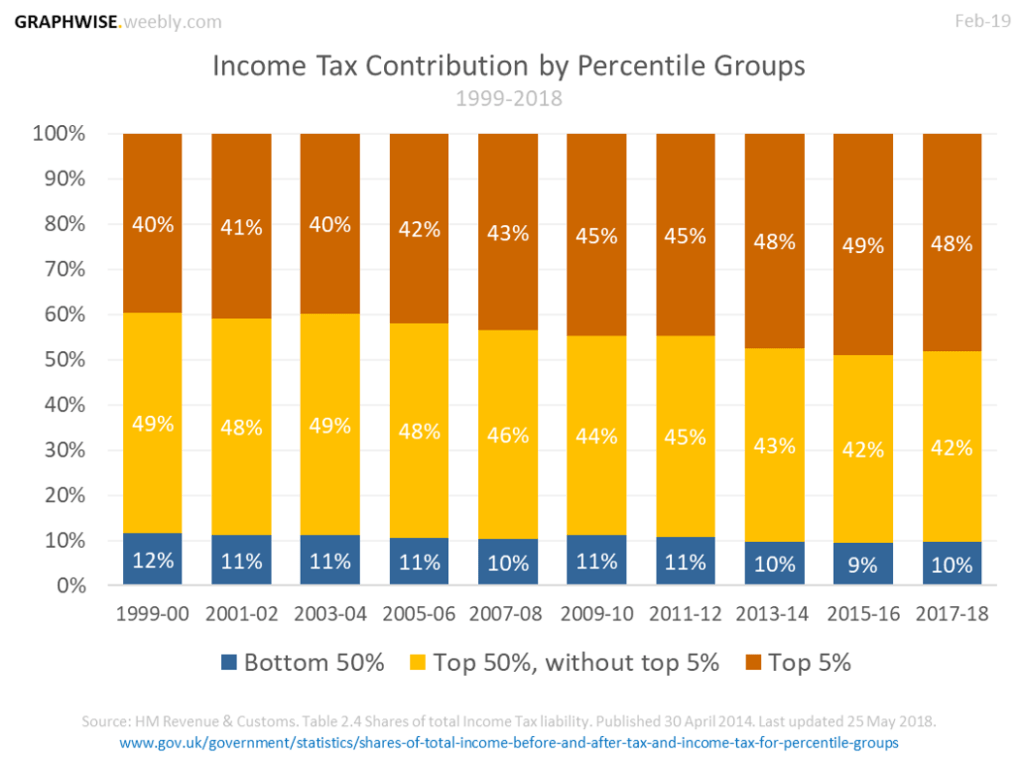
Source: UK Gov via Graphwise
This chart shows that the top 5% of earners contribute almost 50% of income tax. This proportion has been steadily increasing, with top earners contributing more and the middle 50% contributing less. It’s difficult to know what a “fair share” is, but I think most people would instinctively feel that this split is pretty reasonable, or even be surprised by just how much high earners contribute.
This data reflects only earnings and income tax, not wealth. Data on wealth is much more difficult to find, but I imagine it would produce a slightly different picture. My assumption would be that there is a non-trivial proportion of the population who have significant asset wealth but relatively little income, and as a result don’t contribute a huge amount of tax. This is why there are calls for a wealth tax, which I’ll look into later.
The UK’s basic rate of income tax has dropped steadily since the middle of the 20th century, when it sat at 45% immediately after the second world war. By 2007, this had dropped to 20%, where it has stayed ever since.
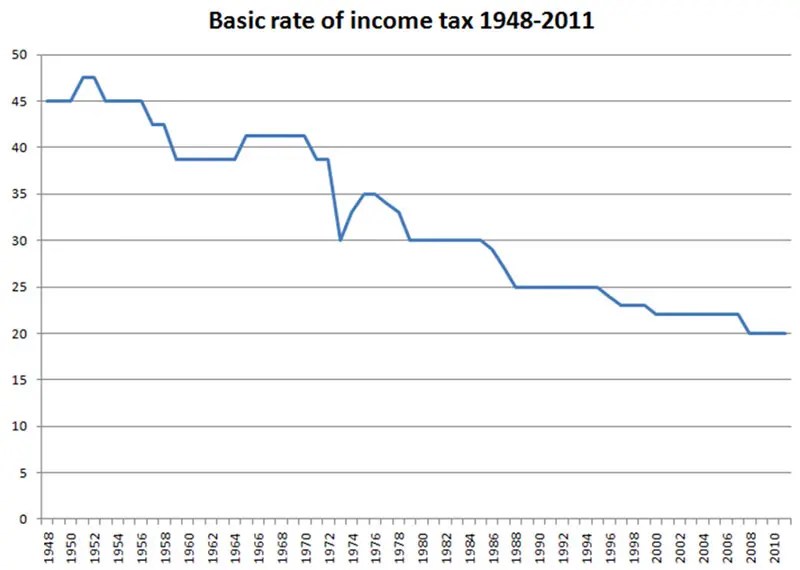
Source: Economics Help
There are various other interesting graphs on income tax rates and thresholds over the last 25 years available here.
The tax landscape is clearly complicated, with a huge number of different levers to pull and variables to adjust. I have summarised the conclusions of my review into the following five points:
- Income tax, national insurance contributions, VAT and corporation tax are currently far, far more significant than any other revenue source.
- Total UK tax receipts as a % of GDP have varied very little since 2004.
- The top 5% of earners contribute almost 50% of income tax, a proportion that has been slowly increasing since 2000 (noting that this group isn’t the same as the top 5% by wealth, although I’m sure there is significant overlap).
- The basic rate of income tax dropped steadily from the 1950s to 2007, but has stayed at 20% since then.
- The UK’s relative overall tax burden currently sits below that of many other developed economies, but not by a huge amount.
Tax, Poverty and Life Satisfaction
It’s not difficult to find data on total tax burden across various countries from the OBR, and on poverty rates from Our World in Data. There is some complexity around which measure of poverty to use; an absolute version based on $/day, or a relative version based on income distribution. I’ve gone for relative poverty defined as the proportion of the population earning below 50% of the national median salary, as this should better take into account variation in living costs. The data is from 2021 because this is a year for which it was all available.
I decided to plot national poverty rate against tax burden for a manageable sample of countries. The sample is somewhat random but generally focused on well developed economies in Europe. I also threw in a few other geographies for reference. Although including less developed economies might demonstrate something, their social, political and economic situations are so different for reasons going far beyond tax policy that it isn’t likely to be a useful comparison. The sample still covers tax burdens ranging from 21% to 47%, which should be plenty wide enough to provide some insight. The countries included are the UK, Ireland, Denmark, Finland, Sweden, France, Germany, Czechia, Estonia, Switzerland, Australia, Chile, and South Korea.
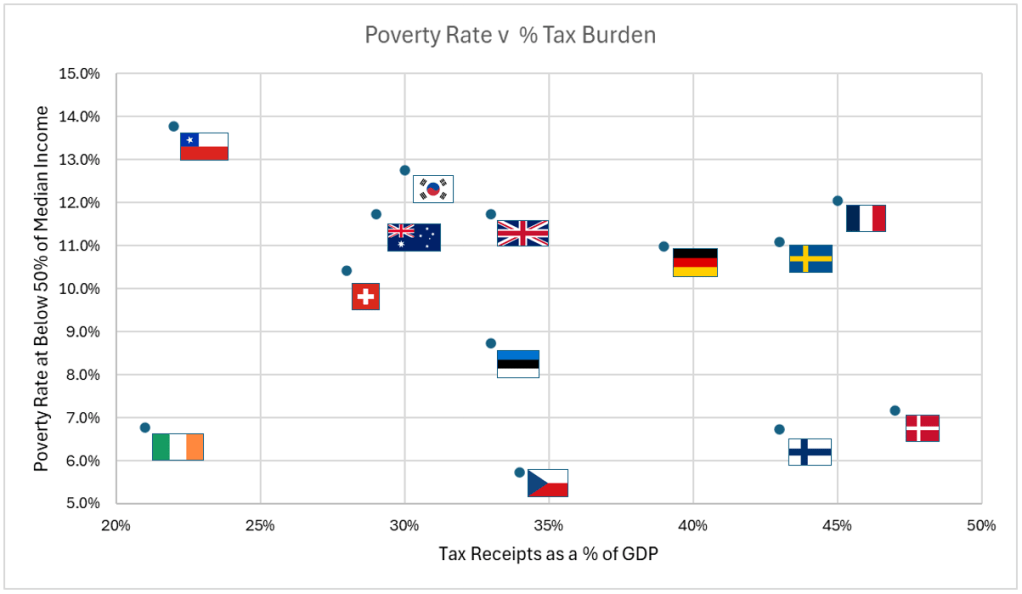
However hard you look, it’s difficult to see any correlation between overall level of taxation and relative poverty rate. That’s not to say that specific tax interventions might not have an impact on poverty, but a blanket statement like “we should increase tax rates to reduce poverty” doesn’t appear to stand up to scrutiny.
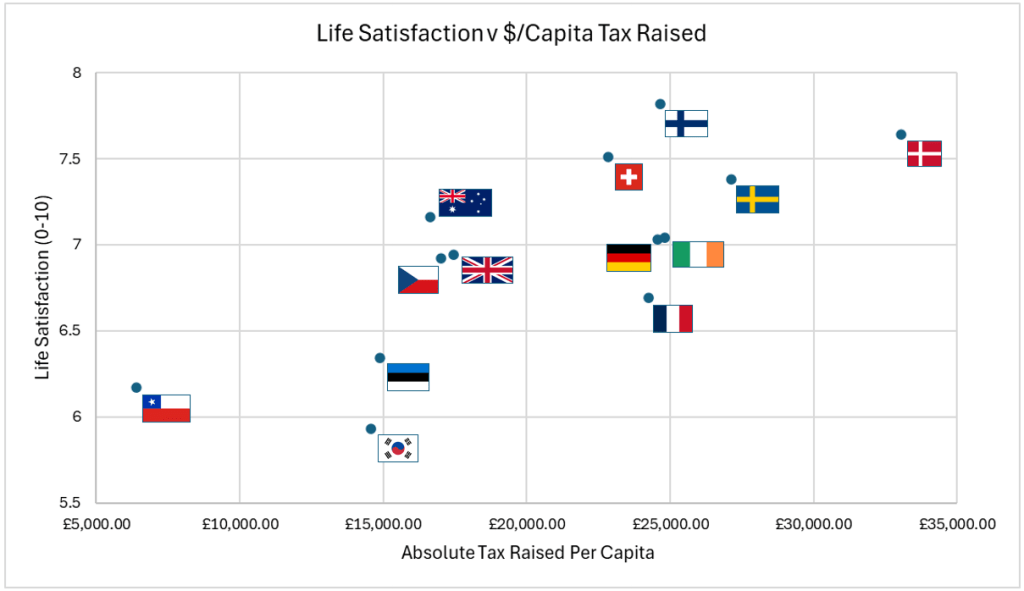
As discussed previously, poverty rate based on income doesn’t tell the whole story. Data on life satisfaction in different countries is gathered by the Gallup World Poll, again neatly displayed by Our World in Data, and should give a nice overall picture of how ‘well-run’ each country is. So, I’ve plotted the same countries’ life satisfaction against their overall tax burden.
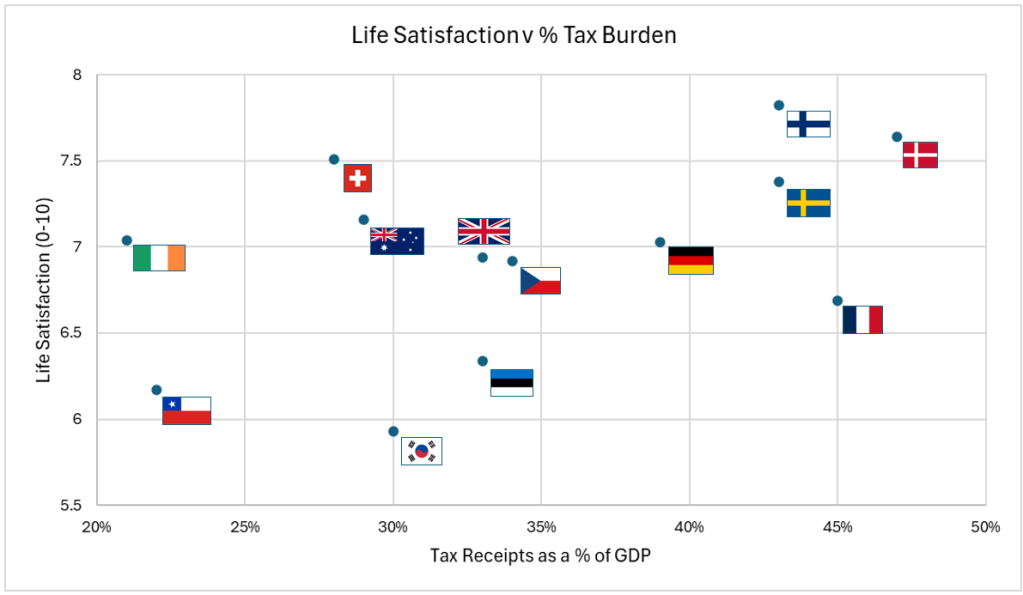
This time you can just about see a positive correlation between tax burden and life satisfaction. It’s not very strong, and is largely driven by the Scandinavian countries with high tax and high life satisfaction, but it’s definitely there. That said, it does look like low tax and high life satisfaction is possible, as shown by Switzerland, Australia and Ireland. So, a blanket statement like “we must increase taxes to improve life satisfaction” could also be met with a legitimate “possibly, but…”.
It’s initially surprising that tax rate doesn’t have a clear impact on either poverty rate or life satisfaction. There are various possible explanations:
- Humans (and their companies) are resourceful, so increasing or decreasing tax causes them to move money or assets around accordingly without actually having much impact on total tax receipts.
- Many tax rate changes have simultaneous push and pull influences. For example, increasing corporation tax means the government will get a bigger share of any profits, but more companies are likely to move operations to a different country.
It’s likely that both these are true, and as a result tax rate in % terms is not as closely tied to absolute tax receipts as you’d expect. If tax rate isn’t closely tied to absolute receipts, it’s obvious why it also isn’t closely tied to poverty or life satisfaction.
It’s also possible that the reason for the lack of correlation is that government spending isn’t correlated with poverty or wellbeing at all. This would be a fiscally right-wing perspective, suggesting that a small state is the way to go.
I will investigate these possibilities in the next section.
What Does Matter?
The hypothesis that tax rates don’t have much impact on poverty or life satisfaction because they aren’t well correlated with revenue is backed up by graphs produced by the Mercatus Center. These are for the USA rather than the UK, but show that tax rates have a surprisingly small impact on absolute tax revenue, which in turn is what dictates absolute government spending on things like healthcare or social security.
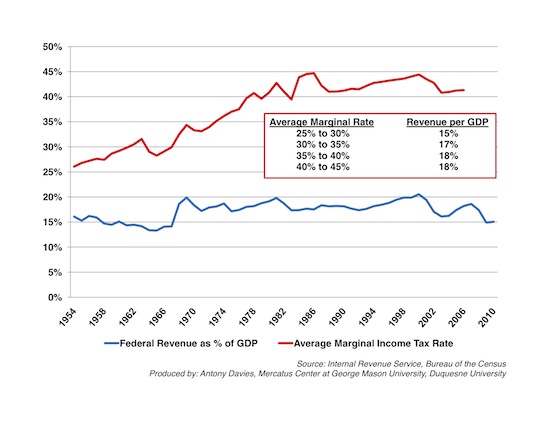
Source: Mercatus Center
Just because changing tax rates doesn’t seem to do much, we haven’t ruled out the idea that absolute tax receipts are tied to reduced poverty or increased life satisfaction. Plotting this graph for both poverty rate and life satisfaction confirms that there is at last a stronger correlation here, with absolute tax raised per capita ($/capita) much more strongly linked to these metrics than the tax rate was.
This shows that the absolute amount of tax does matter to life satisfaction, much more than the rate at which it’s raised. This is a long-winded way of reaching a logical conclusion; that a government with £1M to spend on public services is a government with £1M to spend on public services, whether that’s achieved by taxing the population at 20% or 40%.
The Republic of Ireland is a nice example. It has an extremely high GDP/Capita ($118,000 in 2021, more than double that of the UK), mainly thanks to the presence of many huge multinational corporation headquarters. They were lured there by extremely low corporation tax, with total tax receipts at just 21% of GDP. It all comes out in the wash, and absolute tax revenue per capita is exactly what you’d expect it to be given Ireland’s life satisfaction and poverty rates.
Whether rates are high or low, it’s cold hard cash raised per person that matters most.
Specific Incentives
A corollary of the idea that people and companies are adept at ducking and weaving varying tax rates is that changing rates should be a powerful weapon for incentivizing specific behaviours. Given that overall rate of taxation is less significant than expected when it comes to general metrics like poverty and life satisfaction, this could be a good reason not to completely throw out tax rate as a point of discussion.
One recent example would be Donald Trump’s tariffs. It’s difficult to make coherent sense of the strategy but it’s clear that he is using this form of taxation to change what people do, not simply to collect more money from imports. Another widespread example is tax on tobacco, used in many countries to reduce smoking and the associated healthcare burden. Colombia tripled tax rate on cigarettes in 2016, and by 2018 levels of smoking had fallen by 34%.
In order for specific tax incentives to work they need to be focused. This doesn’t seem to be happening enough in the UK with capital gains tax. It’s one of the most contentious and often debated types of tax, applying to the realisation of an increase in asset value. This includes the sale of shares, bonds, real estate, and other valuable property. As recent governments reduce the impact of Entrepreneur’s Relief (now Business Asset Disposal Relief), they move the level of incentive, or disincentive, applied to someone selling shares in a company they founded towards that for someone selling a holiday home. It’s fairly obvious why that might not optimise for the key metric, absolute tax revenue per capita.
Wealth Tax
One approach to increasing tax revenues without penalising ‘normal’ people is to introduce a wealth tax. This is the idea that someone’s asset wealth, whether liquid or not, could be taxed, making it possible to target those with huge resources. A wealth tax is very much part of the political conversation in the UK but is unlikely to be implemented in the near future.
There are some obvious practical barriers, in particular that it can be difficult to accurately value someone’s estate. Some people may also be asset rich but cash poor, and would struggle to pay without having to make painful changes (forcing change might be the whole point, but it’s hard to imagine there wouldn’t be some unintended consequences). If a wealth tax was proved to be a genuine and meaningful solution, I feel like these challenges are surmountable, so we shouldn’t dwell on them too much.
My instinct is that a wealth tax is a sticking plaster rather than a good long-term solution. Anyone with wealth must have acquired it from somewhere, whether through income, inheritance or capital gains. Wealth has usually been taxed once already at the point it was transferred, so returning each year to tax again and again feels like an admission that the original system isn’t working. My feeling is that tax reform further up the chain would be preferable to an attempt to recoup tax revenue that slipped through the net first time round.
That said, there are clearly people with vast wealth, so completely ignoring their potential to contribute to public spending would be an oversight. There aren’t many existing net-wealth taxes, but we do have a few European points of reference:
- Switzerland – first implemented in 1840, the Swiss wealth tax applies to assets across the world, but rates and allowances vary by Canton.
- Norway – first implemented in 1892, applies a 1% tax to assets above 150,000 EUR.
- Spain – a progressive wealth tax ranging from 0.16% to 3.5% on estates above 700,000 EUR, with significant regional variation.
Switzerland and Norway’s wealth taxes have been in place for so long that they presumably don’t have to grapple with too much cultural or political backlash. Spain’s wealth tax has been up and running for almost 15 years, but the country still scores significantly worse than most of northern Europe on Gallup’s life satisfaction, so at high-level it doesn’t look like a success story. Interestingly, all three examples kick-in at a relatively low net worth. They are applicable to the comfortable, not necessarily the ultra-wealthy. All in all, these limited examples don’t provide compelling evidence one way or the other.
The conversation in the UK is geared towards a tax applicable to a significantly higher level of wealth, such as £10M plus. The Guardian estimates that there are over 10,000 individuals in the UK with net worth above £20M, although accurate data is hard to find. The Sunday Times Rich List gives us greater detail on the 350 wealthiest, coincidentally starting at £350M for Sir Lewis Hamilton. 165 of the 350 are billionaires, and the list’s combined wealth is £965B.
If you give these 350 wealthiest a generous £100M tax free allowance, that still leaves £930B. Taxing each individual’s wealth above £100M at, for example, 2% would raise £18.6B a year.
By comparison, Labour’s VAT on private school fees will raise £460M in 2024/25, 40 times less than this £18.6B figure. That’s with the chunky £100M wealth tax free threshold, and ignoring all those between £100M and £350M, who would also end up contributing a significant amount. An ultra-wealth tax clearly has potential to move the needle and really boost that important absolute money raised per capita metric.
I do have some sympathy for the ultra-wealthy when it comes to tax. I’m sure their stories are incredibly varied, but many will have worked extremely hard for their success, taken big risks, and as we saw in the income tax breakdown, already contribute a huge amount to the public purse. Although there are inevitably some eccentric exceptions, I wonder if a reluctance to pay even more is related to the mechanism of tax rather than a desire to hoard all their cash. A non-trivial number of billionaires have signed the Giving Pledge, agreeing to give away the “majority” of their wealth. In theory, that’s them voluntarily signing up to a wealth tax of almost 100%.
It’s easy to guess why the spending mechanism might be an important factor – if you were given more money than you could reasonably spend would you rather see it disappear via a soulless tax return, or proactively donate the money to a tangible project aligned with your own interests?
There are some clear question marks around individual power and ulterior motives, but perhaps a compromise would be workable. A mandatory donation amount could easily be progressive (e.g. 1% of wealth above £20M, 3% above £100M) and combined with a list of government approved schemes in which the donator could be directly involved.
A multi-millionaire from the Midlands could choose to fund teaching assistants in Birmingham, or public housing in Stoke, and be close enough to actually see the impact of their money. It could even be called something euphemistic like a “Key Contributors’ Scheme” rather than giving the Daily Mail an opportunity to write another headline about a tax raid.
Conclusions
This review of tax policy became longer than I expected. I’ve only scraped the surface, but still feel like I’ve made some interesting discoveries. I assume all these discoveries have been made before, but there’s nothing quite like coming to your own conclusions. I can summarise my research into four key points.
Overall tax burden, expressed as a % of GDP, has almost no correlation with relative poverty, and only a very weak correlation with life satisfaction. Tax rate as a % is only loosely related to absolute tax revenue, which explains why it doesn’t have much impact. Debates around whether any given tax rate should be “28% or 32%” are likely to be almost completely meaningless in terms of revenue generation.
That said, because people are good at rearranging things to avoid tax, it should be an effective way to incentivise specific behaviours. Adjusting tax rates in this context is worthwhile and should be used in a deliberate and focused way.
There is a strong correlation between life satisfaction and absolute tax revenue, expressed as $/capita. This debunks the idea that a small state is best, and is the single metric we should be optimising for. You might think it doesn’t matter which metric dominates the debate, but this fails to give sufficient weight to the idea that you make what you measure. This is the concept that you inevitably improve whatever you focus on, and by contrast won’t improve what you don’t. Noone would talk about their salary as a % of company revenue because it wouldn’t mean anything to anyone. It’s your absolute pay that influences how you live your life, and tax is exactly the same.
Although a wealth tax could get tricky, there is a huge “revenue opportunity” from the ultra-rich. Even a relatively small contribution could have a much bigger impact than other tax tinkering. To avoid an exodus of wealthy individuals and their assets, which history shows would probably mean tax revenue stays roughly constant, compromise could be made on the way a wealth-based scheme is administered. This could counter the negative emotion associated with increasing tax by improving the visibility of contributions.
In the UK, it is likely that increasing our total tax raised (£/capita) would reduce poverty and improve life satisfaction. Fiddling with inheritance and school fees doesn’t move the needle, it would take more meaningful reform, all while tracking the metric that matters. This might still mean a small increase in income tax, which could have a much bigger absolute impact than almost anything else, and bigger adjustments to the relatively insignificant CGT system. The ultra-wealthy have a lot to give too, but only if they’re kept emotionally on-side.

Leave a comment